Ever wondered how to make a beatiful and powerful call graph from your python profiler? I have found that there is no need to install heavyweight tools like KCachegrind or even worse, buying expensive IDEs. The solution is simple.
Wrap the part of code you want to inspect (here a bogus function with name my_super_slow_function()) with the following call:
def my_super_slow_function():
    return 1

import cProfile
pr = cProfile.Profile()
pr.enable()

my_super_slow_function()

pr.disable()
pr.dump_stats(file='profile.pstat')
Then run your Python code as always. This result in a "profile.stat" file that you can analyze using graphviz and the wonderful tool gprof2dot.
First install graphviz (on Ubuntu a simple thing):
sudo apt-get install graphviz
then install gprof2dot from the PyPi repositories:
sudo pip3 install gprof2dot
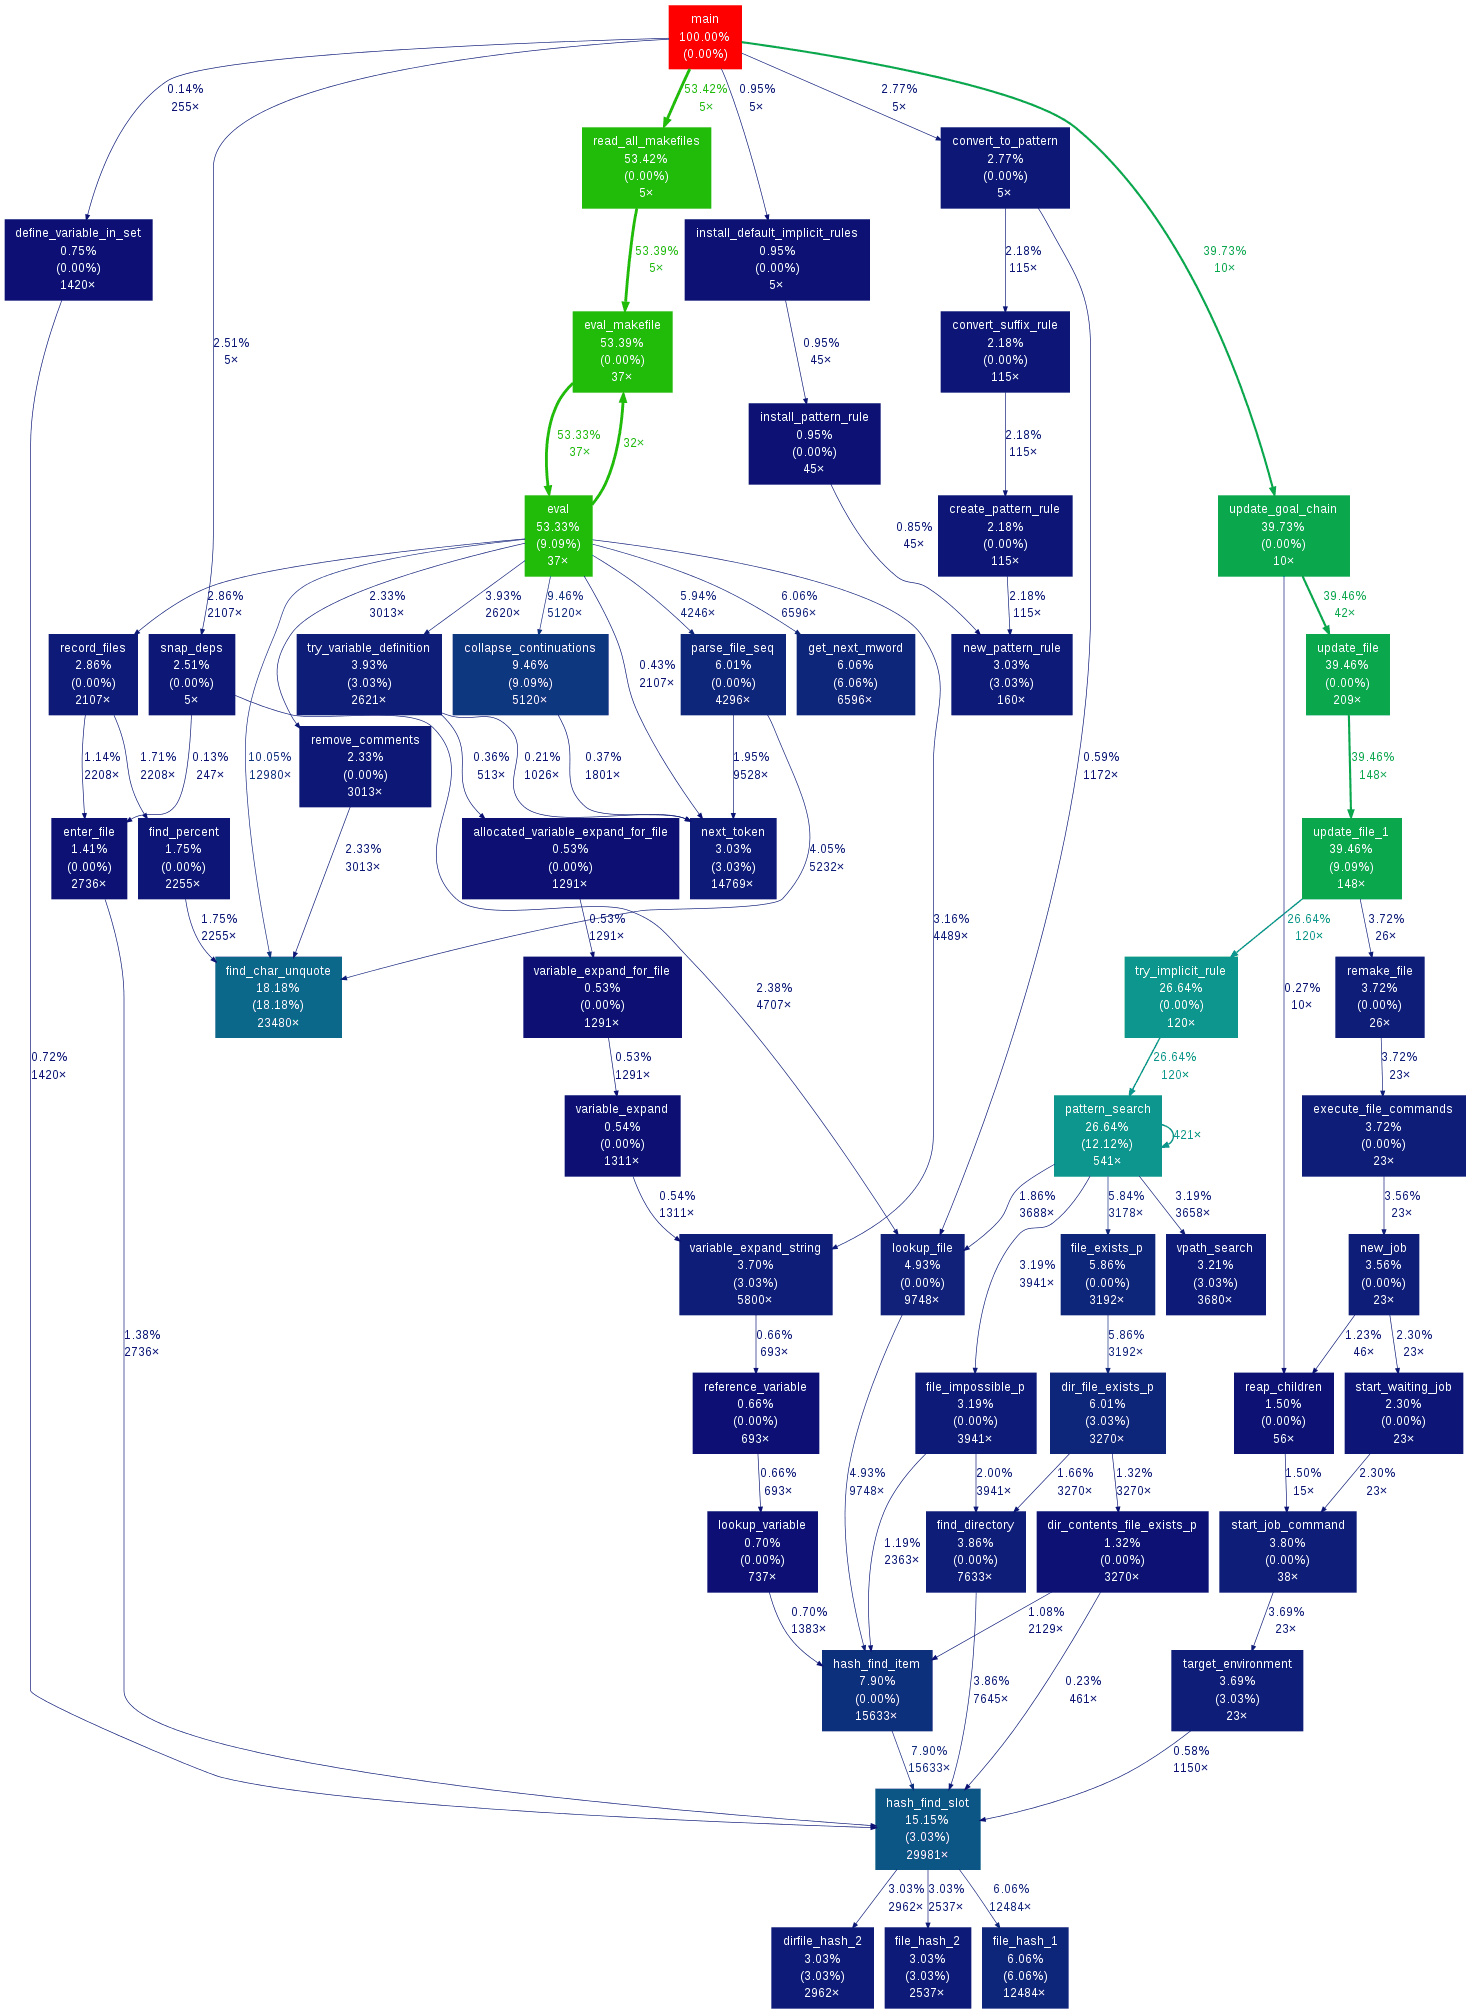
Finally you can convert the profile.stat file into a beatiful call graph.
gprof2dot -f pstats profile.pstat | dot -Tpdf -o profile.pdf
Take a look at the output file. Isn’t it great?
Let's talk!
I'm Carlo Nicolini — I am interested on the reliability of AI reasoning systems (interpretability, inference-time methods, probabilistic language programming) and on quantitative portfolio optimization (I am a maintainer of skfolio). If you're working on something in these areas and think we might collaborate, chat, discuss, I'm happy to talk about it!
The best way to reach me is on via DM on LinkedIn.