Faceting images or generic plots with Seaborn and Python matplotlib
I’ve found myself working with large pandas dataframe.
Differently from the typical usage of pandas dataframes, in some cells I have numpy.array as content, or other types of data.
Here we call these non-standard columns as x and y.
Depending on the values of some indicator columns, that here we call condition1, condition2 , I wanted to do a faceting where in each facet corresponding to the specific value of condition1 on the rows and condition2 on the colums, I can show a standard plot of x vs y.
There are mainly two approaches here to solve this problem.
The first is the standard of melting the dataframe into a three columns dataset, where for every single couple of values of condition1 and condition2 we unroll the values of x and y.
This is described in this question on stackoverflow
The second approach that I’ve found much clearer is to focus on the concept of plotting function provided to the grid method of the sns.Facetgrid class.
Typically people is expected to provide a simple plotting function such as plt.plot or plt.bar etc.
However, looking at the seaborn code, I’ve noted how any function returning an instance of a matplotlib.figure can be used.
The case of faceting plots
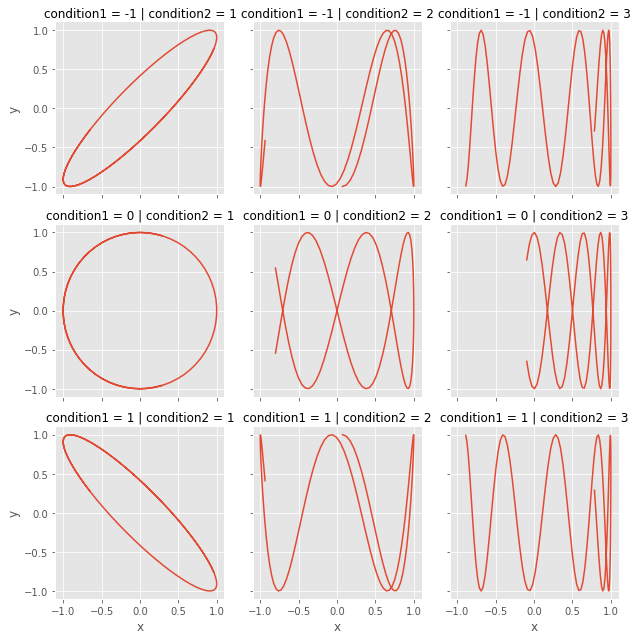
Here is a minimally working example (MWE) example where I try to plot a function of variables x and y depending on the specific values of two other faceting variables. The plots are some custom function that show that for each different condition1 and condition2 different plots are created.
import matplotlib.pyplot as plt
import numpy as np
import pandas as pd
import seaborn as sns
plt.style.use('ggplot')
T = []
condition1 = [-1,0,1]
condition2 = [1,2,3]
x = np.linspace(-5,5,100)
# Let's build our dataframe
for c1 in np.unique(condition1):
    for c2 in np.unique(condition2):
        T.append({'condition1':c1,
                  'condition2':c2,
                  'x':np.cos(x/c2+c1),
                  'y':np.sin(x*c2-c1)})

df = pd.DataFrame(T)
The trick is to design the exact function to be passed to the FacetGrid.map method. It has to correspond to the mappable values.
grid = sns.FacetGrid(df, row='condition1', col='condition2')
grid.map(lambda _x,_y, **kwargs : plt.plot(_x.values[0],_y.values[0]), 'x','y')
In other words the variables ‘x’ and ‘y’ get mapped as input to the first argument of the FacetGrid.map method. Here I have also highlighted that the signature of the lambda function provided hasn’t to match exactly the name of the variables to be used in faceting, as I’ve used _x as placeholder for the 'x' column in the df dataframe.
The case of faceting images
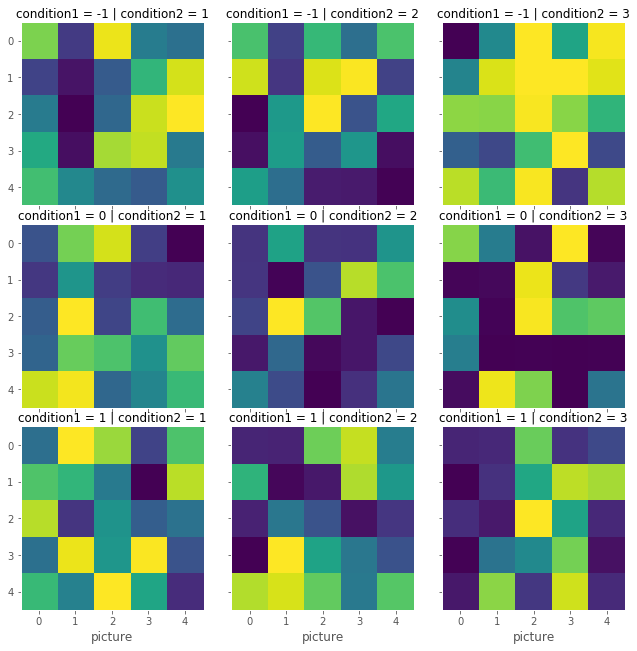
One can do more complicate things. It is possible to facet images that depend on some condition.
Let us build again our omnicomprehensive dataframe, each row of the picture column contains a numpy.array with two dimensions, to be shown as a matrix. Here for simplicity we generate 5 x 5 random numbers and try to remove the white grid, by using a lambda with a 2-tuple as return argument:
import matplotlib.pyplot as plt
import pandas as pd
import seaborn as sns
plt.style('ggplot2')
T = []
condition1 = ['a','b','c']
condition2 = [1,2,3]
x = np.linspace(-5,5,100)
y =
# Let's build our dataframe
for c1 in np.unique(condition1):
    for c2 in np.unique(condition2):
        T.append({'condition1':c1,
                  'condition2':c2,
                  'picture':(np.random.random([5,5])+c1)**c2,
                  })
df = pd.DataFrame(T)
grid = sns.FacetGrid(df, row='condition1', col='condition2')
grid.map(lambda x, **kwargs : (plt.imshow(x.values[0]),plt.grid(False)), 'picture')
The result is the following:
Other cases should now be clear, always map a function with the same number of input arguments as the number of mapping variable passed to FacetGrid.map, and make use of the .values[0] method, otherwise a subslice of a pandas dataframe is passed to the plotting function.

